Phase Portrait Generator
Visualize the dynamics of differential equation systems with accurate, clearly labeled phase portraits
Phase portrait
Your generated content will appear here
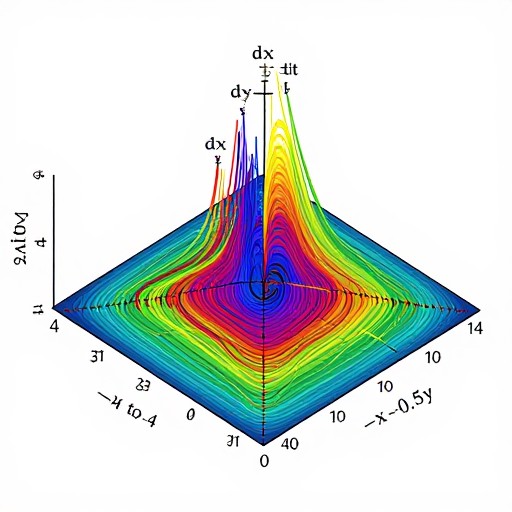
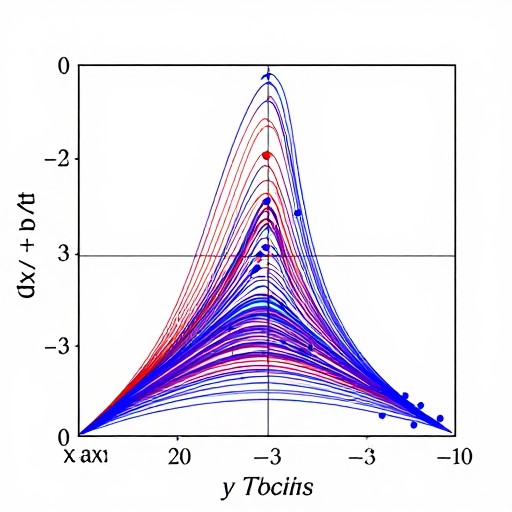
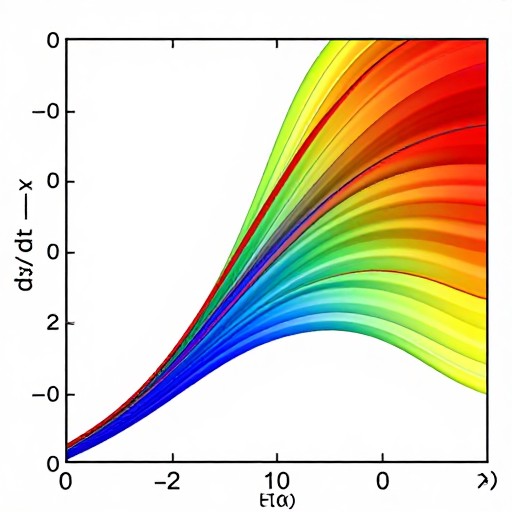
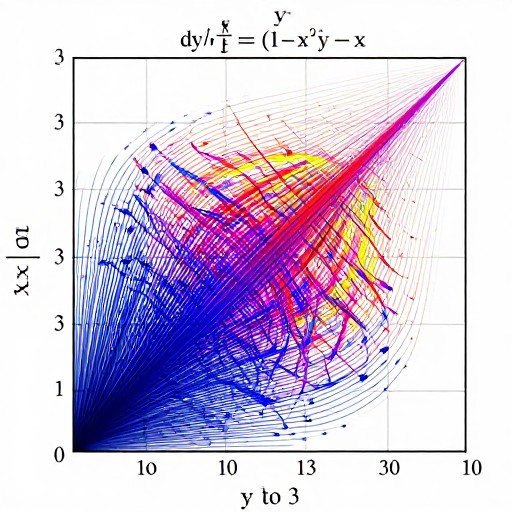
Phase Portrait Generator Examples
See what others have created
How to Get Started
Simple steps to create amazing results
Input Your Differential Equations
Enter your system of differential equations using the intuitive form fields. Specify dx/dt and dy/dt equations with standard mathematical notation.
Customize Your Plot
Set the x and y axis ranges, adjust grid density, choose color schemes, and add initial conditions or parameters to visualize your specific system.
Generate & Download
Click generate to create your phase portrait instantly. Download your high-resolution visualization in multiple formats for presentations or publications.
Main Features
Powerful capabilities at your fingertips
Multiple System Types
Support for linear and nonlinear systems, autonomous equations, and various dynamical systems including predator-prey, pendulum, and custom models.
Advanced Customization
Fine-tune trajectories, adjust vector field density, customize colors, add nullclines, equilibrium points, and direction fields for comprehensive analysis.
Real-Time Visualization
See your phase portrait update instantly as you modify parameters. Interactive exploration helps build intuition about system behavior.
Professional Export
Download publication-quality images in PNG, SVG, or PDF formats. Perfect for academic papers, presentations, and teaching materials.
Smart Analysis Tools
Automatic detection of equilibrium points, stability analysis, and trajectory classification to help understand your system's behavior.
Preset Examples
Start with classic dynamical systems like van der Pol oscillator, Lotka-Volterra, or damped harmonic oscillator as learning templates.
Frequently Asked Questions
Everything you need to know
What is a phase portrait?
How do I input my differential equations?
Can I customize the phase portrait plot?
What equation formats are supported?
How do I interpret the generated phase portrait?
Can I save and share my phase portraits?
Ready to Visualize Your Dynamical System?
Create beautiful, accurate phase portraits in seconds. Perfect for students, researchers, and educators exploring differential equations.